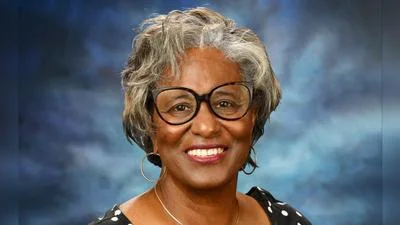
Nate Sheppard Principal at Maroa-Forsyth Middle School | Official Website
Nate Sheppard Principal at Maroa-Forsyth Middle School | Official Website
Of the 14,051 students attending Macon County schools, 56.2% were white. African American students were the second largest ethnicity, making up 27.3% of Macon County students.
In the previous school year, white students were also the most common group in Macon County, representing 57.1% of the student body.
Johns Hill Magnet School, Maroa-Forsyth Grade School, and Mt. Zion High School had the most diverse student body in Macon County, including Asian, African American, Hispanic, multiracial, and white.
The Illinois State Board of Education’s budget for fiscal year 2026 will increase from nearly $10.8 billion to about $11.2 billion. This includes a $307 million boost for K–12 schools, marking the smallest annual increase since 2020.
The agency has paused about $50 million in funding previously allocated through the Evidence-Based Funding formula for the Property Tax Relief Grant while reviewing its impact on local tax relief. Officials say the pause could affect the timing and amount of property tax relief available to taxpayers.
| School name | Most prevalent ethnicity | Percent of Total Student Body | Total Enrollment |
|---|---|---|---|
| American Dreamer STEM Academy | African American | 70.1% | 364 |
| Argenta-Oreana Elementary School | White | 86.2% | 455 |
| Argenta-Oreana High School | White | 81.9% | 265 |
| Argenta-Oreana Middle School | White | 82.2% | 174 |
| Dennis Elementary School | African American | 52.5% | 520 |
| Eisenhower High School | African American | 48.5% | 885 |
| Franklin Grove Elementary School | African American | 54.1% | 460 |
| Hope Academy | African American | 62% | 527 |
| Johns Hill Magnet School | African American | 41.1% | 625 |
| MacArthur High School | African American | 50.3% | 999 |
| Maroa-Forsyth Grade School | White | 75.5% | 584 |
| Maroa-Forsyth Middle School | White | 76.3% | 245 |
| Maroa-Forsyth Senior High School | White | 79.8% | 337 |
| McGaughey Elementary School | White | 92.3% | 366 |
| Meridian Elementary School | White | 92.7% | 466 |
| Meridian High School | White | 91% | 288 |
| Meridian Middle School | White | 91.4% | 198 |
| Michael E. Baum Elementary School | African American | 38.4% | 323 |
| Montessori Academy for Peace | White | 47.4% | 648 |
| Mt. Zion Elementary School | White | 91.4% | 347 |
| Mt. Zion High School | White | 89.3% | 759 |
| Mt. Zion Intermediate School | White | 91.9% | 521 |
| Mt. Zion Junior High School | White | 89.4% | 398 |
| Muffley Elementary School | African American | 45.2% | 389 |
| Parsons Accelerated School | African American | 46% | 465 |
| Robertson Charter School | African American | 88.4% | 329 |
| Sangamon Valley High School | White | 92.4% | 184 |
| Sangamon Valley Primary School | White | 87.3% | 157 |
| South Shores Elementary School | African American | 47.8% | 320 |
| Stephen Decatur Middle School | African American | 46.2% | 474 |
| Warrensburg-Latham Elementary School | White | 83.4% | 458 |
| Warrensburg-Latham High School | White | 85% | 307 |
| Warrensburg-Latham Middle School | White | 79.4% | 214 |
Information in this story was obtained from the Illinois State Board of Education. The source data can be found here.


 Alerts Sign-up